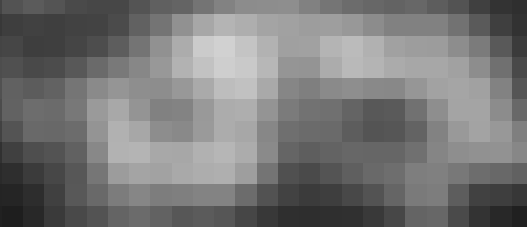

| Video of input data. | |

|
Widefield image created by averaging video. |

|
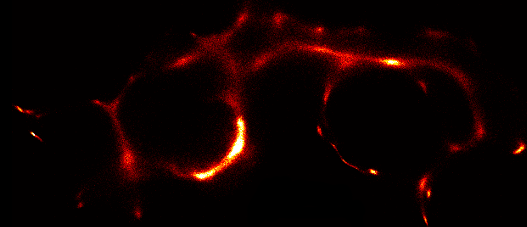
Reconstructed 3B results. |
|
|
If you are interested in using this method, it is available to download under the GPL (general public license). In brief, this means that you are allowed to use the software, but any software you write which uses this software must make its source code available (so its use in commercial closed source software packages is not permitted).
As with all high resolution microscopy techniques, 3B has advantages and drawbacks. Below is some guidance as to the issues which will determine how well suited 3B is to solving your particular problem.
However, note that 3B has a very significant computational cost. Being able to process the data for a single static cell would take several days on a state of the art desktop computer. If you wish to use 3B for large areas or video data, you will need access to a cluster. If you do not have access to a cluster, but you think that 3B offers a significant advantage for your system, then contact us at threeb@coxphysics.com and we may be able to help. Note that if you only need to deal with images in which a few fluorophores are overlapping in each frame, there are alternative analysis techniques such as DAOSTORM which do not have such a high computational cost, and are also freely available.
If you are imaging fixed cells using organic dyes, you will need to introduce a reducing agent to induce blinking. Recipes for reducing embedding media are available (e.g. here). If you are imaging live cells using standard fluorescent proteins (such as GFP), you can use either laser or arc lamp illumination. Data needs to be recorded using an EMCCD camera to achieve a good signal-to-noise ratio. In order to speed up data collection, you should create a region of interest around the area you want to measure. However, leave a border of at least 10 pixels larger than the area you are interested in. It is best if there are no in-focus fluorophores in this border region.
Although 3B can extract information from what appears to be very poor quality
data, it has limitations. If there is little underlying information in your
data, you will not get an image characteristic of the underlying structure. If
your reconstructed image includes a visible grid pattern, this is an indication
that reconstruction has failed.
Download Software
Previous versions of the software and manuals are here.
Plugins>Three B>3b tutorial once the plugin
is installed or refer to the reference manual.
Or [get the manual as a PDF here].
Updated January 31st 2013, 05:29